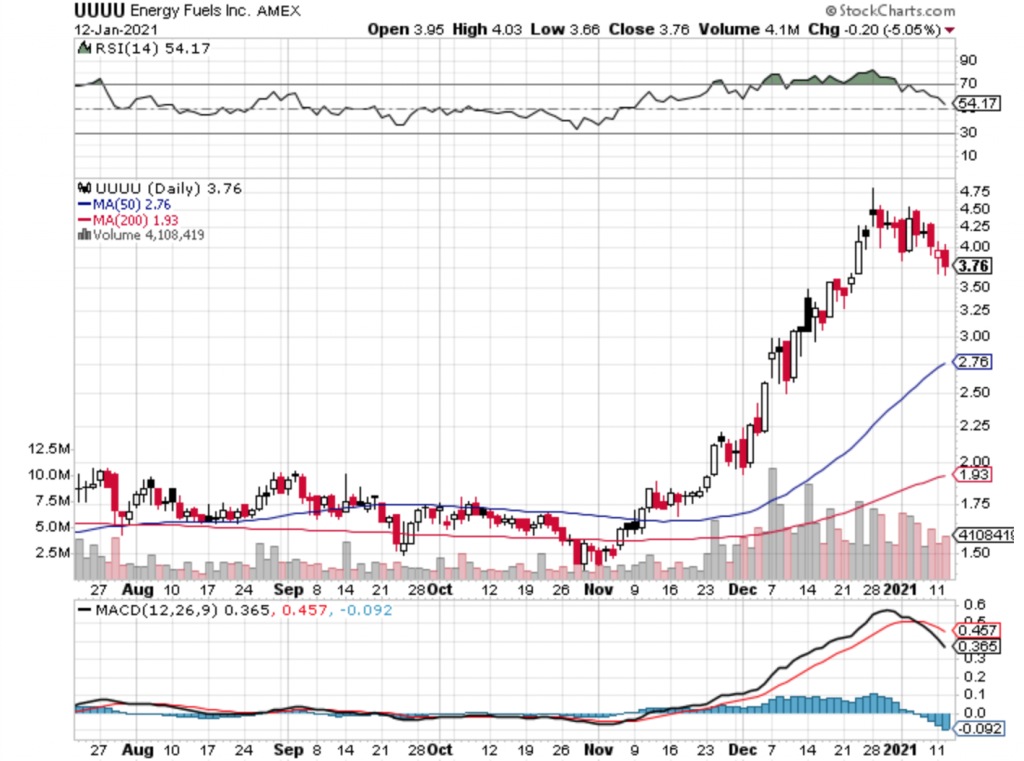
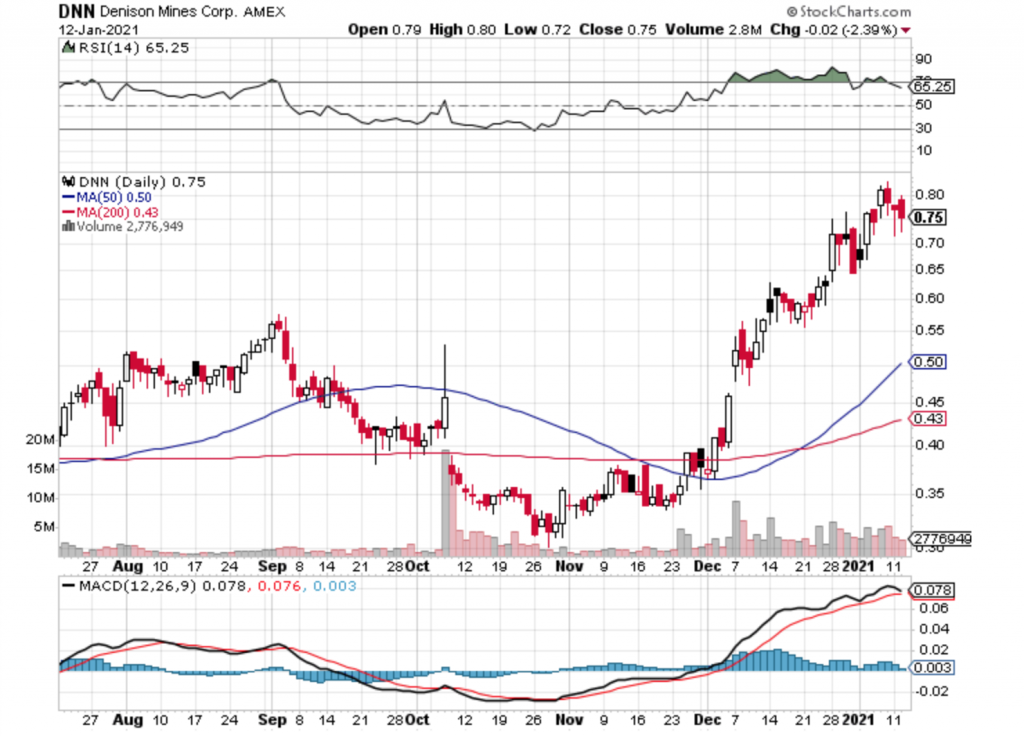
Uranium has been on a rocket ride since early November 2020 and we have enjoyed the run up. Here are a few daily charts of our favorite uranium plays Energy Fuels ($UUUU) and Denison Mines ($DNN) courtesy of StockCharts.com:

On the chart above notice how the MACD (Moving Average Convergence Divergence) black line has crossed below the red signal line. This is a bearish indicator for the Energy Fuels daily chart and could mean that a further correction is warranted and may take longer to play out.

In the case of Denison Mines ($DNN) above, the MACD line has not crossed over yet, but it is threatening to do so. Again, a potential bearish indicator for the daily chart and this could take longer to play out fully.
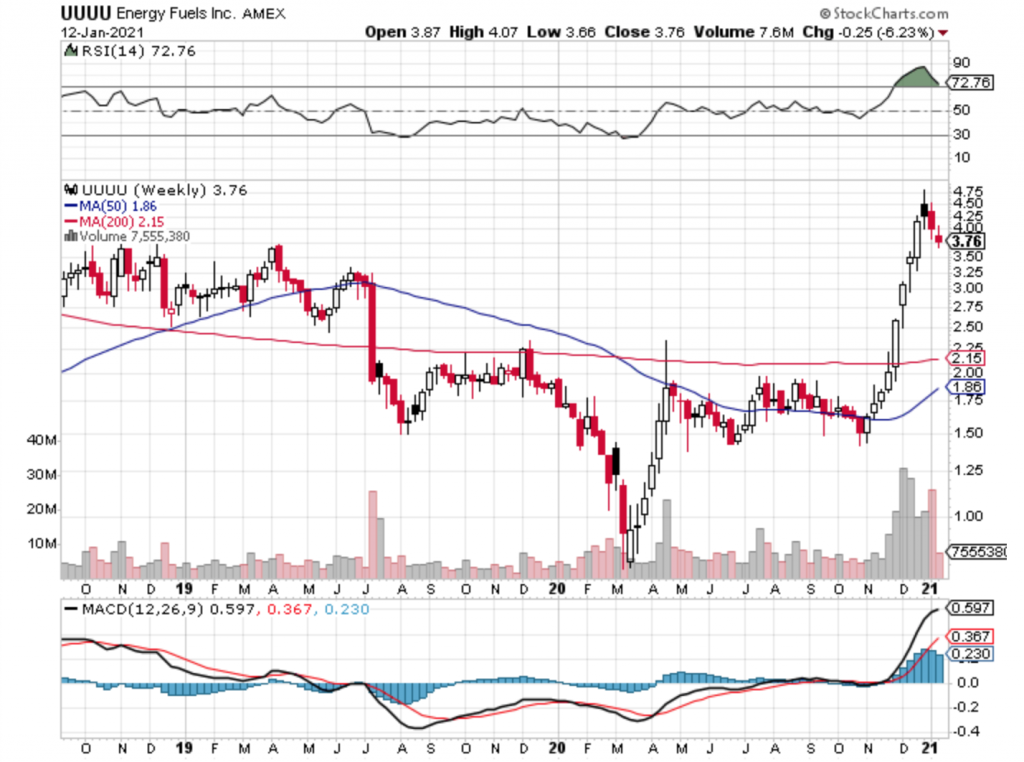
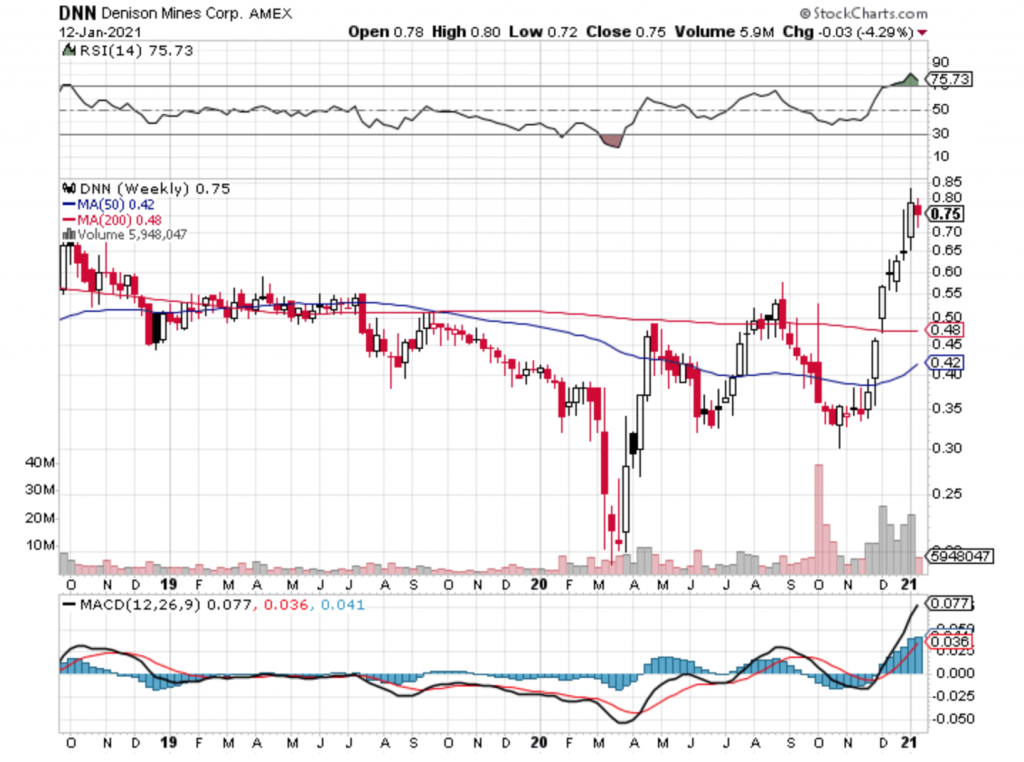
We feel like its important to take a look at the larger (macro) picture, so here are the weekly charts for Energy Fuels and Denison Mines:


Both of these weekly charts show a lot of strength and this correction may still be in its early stages. However for the long term we feel this correction is temporary and we are still very bullish on the uranium sector as a whole and believe we are still in the early innings of a longterm bull market.
Disclosure: We are long shares of Energy Fuels ($UUUU) and Denison Mines ($DNN). We are also both long and short call options of Energy Fuels ($UUUU) and Denison Mines ($DNN).
